Modelling
Modelling is the process of trying to figure out how an election would have turned out if a different set of rules had been used. Models can be constructed with spreadsheets, computer programs, or even by hand.
Local Proportional Representation (Local PR) has been modelled rigorously by Byron Weber Becker using the same techniques as his submission and testimony to the Parliamentary Committee on Electoral Reform. The detailed results compare LPR with STV (Single Transferrable Vote), FPTP (First-Past-The-Post) and AV (Alternative Vote) for several different scenarios.
It’s important to remember that while models give important insights into how a system behaves, they can’t be used to actually predict elections. There are simply too many assumptions. For example, the Local PR models are based on 2015 (Canada) and 2017 (BC) election data. The 2015 election was heavily influenced by strategic voting which hurt the NDP and Greens, in particular. With Local PR’s preferential ballot we could expect more votes for both of those parties, which these models don’t take into account.
Modelling Summary
Local PR by itself is quite proportional while Local PR+ (with top-up seats) is very proportional. Local PR has a Gallagher Index of 4.10 on a simulation of the 2015 election with slightly higher indices on synthetic elections where one party receives more than 40% of the vote.
The results show that the Conservative, New Democrat, and Bloc’s share of the seats matches their share of votes almost exactly.
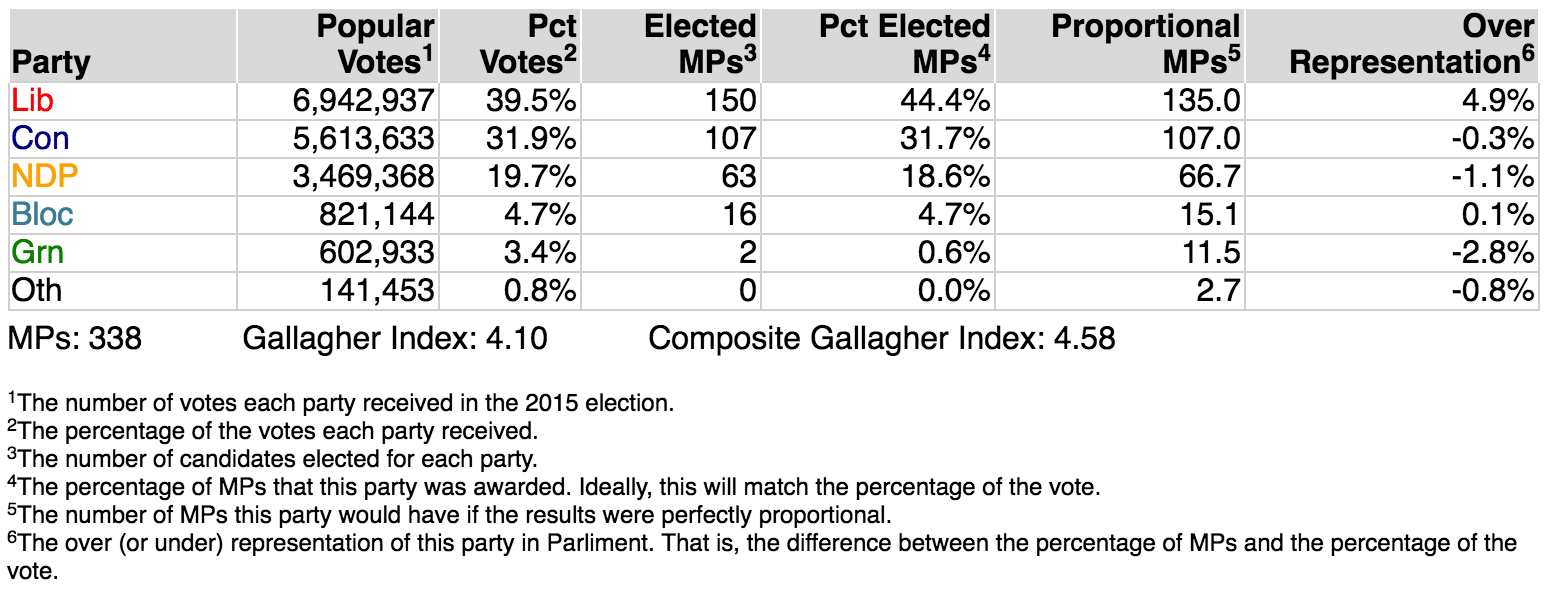
The Liberals would continue to enjoy an undeserved surplus of seats, but only 149 instead of 184, or 4.6% more than proportional. This results from several factors: being a large, centrist, party; winning seats in the territories (which have only 1 seat each and so can’t be made more proportional), etc.
The Liberal boost comes at the expense of the Green party, which still earned only one seat in the simulation in spite of deserving 11 or 12. The Local PR+ model (adding top-up seats) would address this situation. Even under Local PR, Greens are in a better position to win seats due to the lower quota and coalescing votes across a region. We would also expect many more people to vote Green once strategic voting is no longer an issue.
Modelling Different Voting Patterns
The following graph illustrates the results of modelling 7 elections under First-Past-The-Post. The left-most election (E1) starts with the Liberals earning 27.6% of the votes (the heavy red dot) and 17.5% of the seats (the light red dot). The Conservatives, with 43.8% of the vote win 63.6% of the seats.
As we progress from left to right, through election E2, E3, and up to E7, the share of the Liberal vote grows from 27.6% to 49.0%. That’s a difference of 21.4%. However, their share of the seats grows much faster, from 17.5% to 81.4%. That’s a difference of almost 64%!
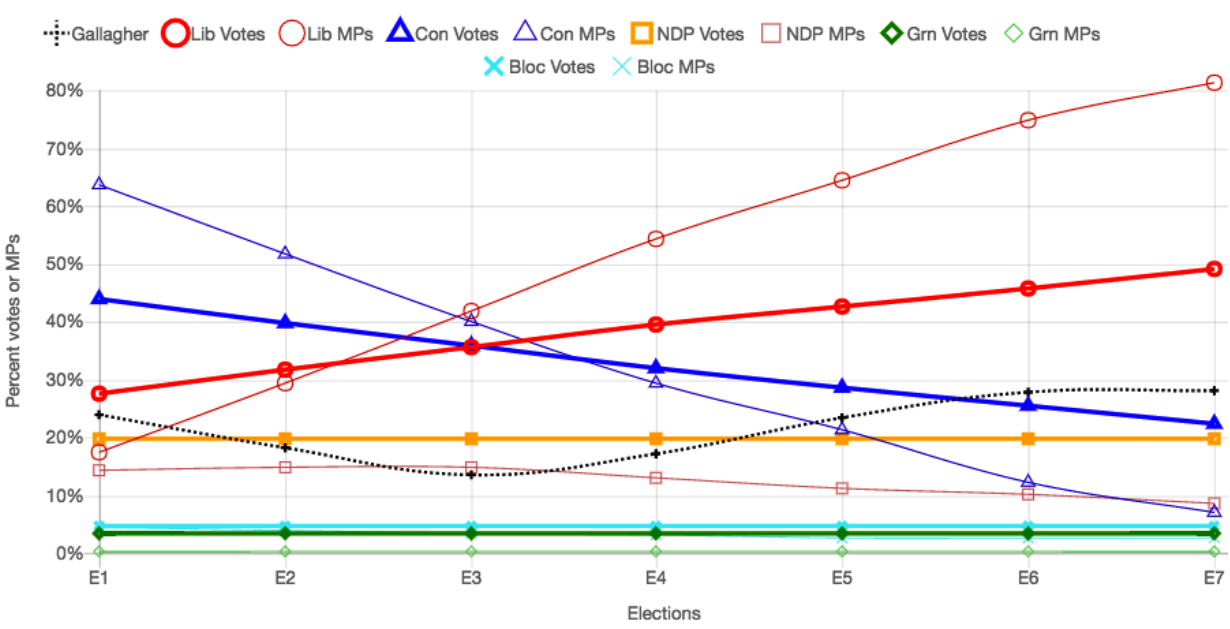
In a perfectly proportional system the heavy dots (votes) and the light dots (seats) would be on top of each other. Local PR comes closer to achieving that ideal:
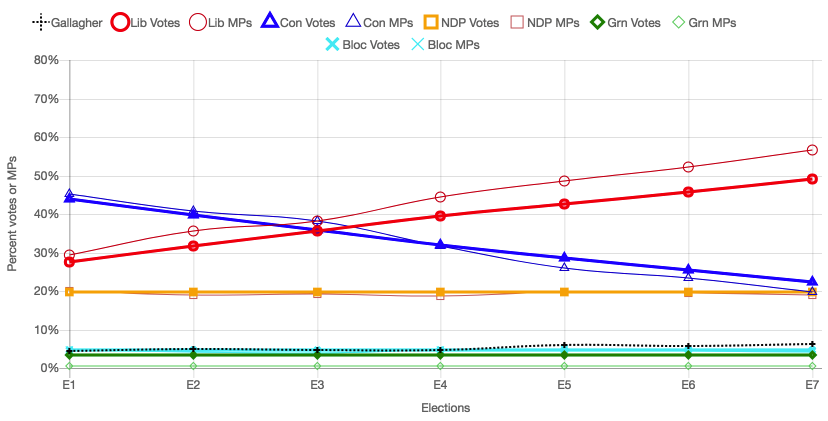
Local PR+ comes even closer to proportionality across a wide range of elections. Notice, in particular, that the Gallagher Index (black dotted line) is much better across the entire range and that the Greens have their deserved numbers of seats in all but the most extreme elections.
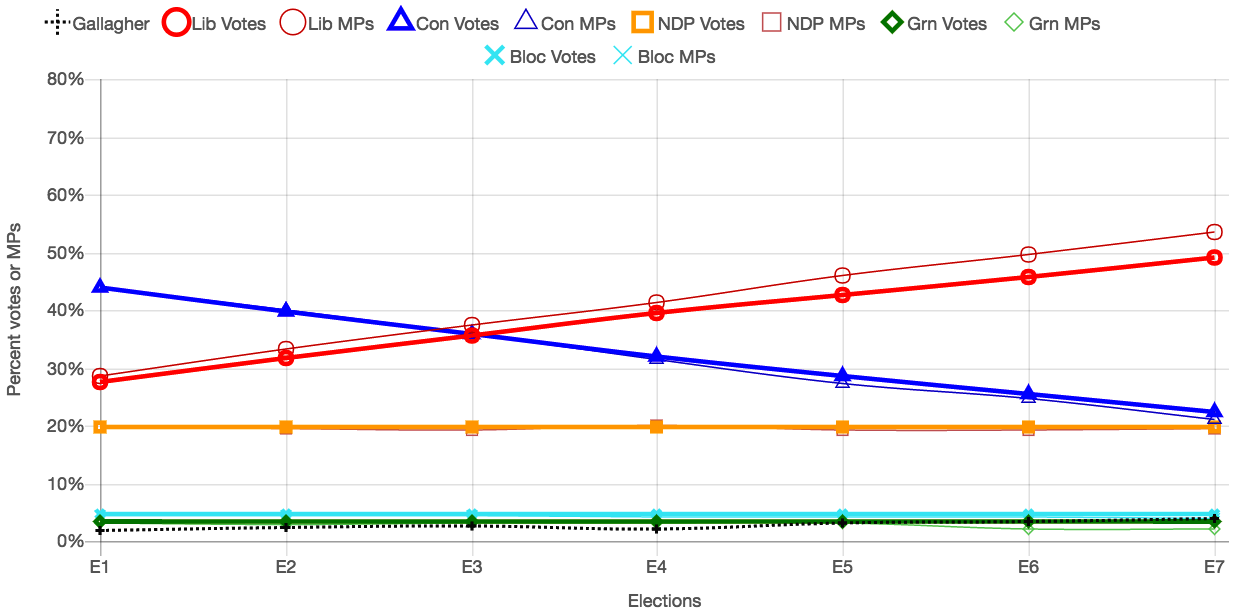
Election E4 is built with data from the 2015 election. The other 6 elections are derived from the 2015 data by systematically shifting votes from Liberal candidates to Conservative candidates (elections E1, E2, and E3) or from Conservative candidates to Liberal candidates (elections E5, E6, and E7).
The detailed results show similar analyses that shift voters between NDP and Liberals as well as Greens and Liberals.
Notes
The model uses regions that average only 5.6 MPs (or ridings) in each. That’s a pretty low number. Proportionality would be improved (along with more opportunities for the Greens) by making that average larger.